Creating a Dashboard of Charts
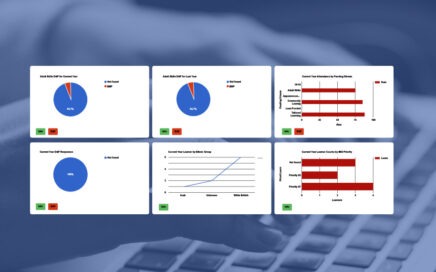
An introduction to creating a dashboard of charts for members of staff, multiple dashboards can be created using categories, and charts can be individualised to be relevant to an individual staff member.
An introduction to creating a dashboard of charts for members of staff, multiple dashboards can be created using categories, and charts can be individualised to be relevant to an individual staff member.

This video show an example of how to generate a chart for Study Aim Targets (SATs) on the web. This will enable a standardised Study Aim Target Dashboard to be created for all SATS.

How to create a pivot table for Web Reports, add calculated columns, format values, colourise values using formulas, save a formatted sheet, and then apply the saved formatting back into the TERMS web report so it is always appears formatted.

This course will take you through the basics of creating an ILP, attaching it to a course and presenting it online for learners and tutors.

This lesson will show how individual courses can be configured within TERMS to allow the Tutor to record results online.

This course will take you through defining the types of proofs you wish to collect, the process for recoding and uploading proofs within TERMS and by learners via the web. Finally how to reject and verify proofs.

This lesson will show how data can be exported from TERMS for import into Moodle

Using the options within TERMS to get the best results on your web courses. From information only to full enrolment with PIN numbers, hybrid provision and more options under your control.

This course will take you through the basics of creating a web survey, attaching it to a course and processing the responses.

This is a set of videos covering the common questions that we are asked about WordPress